Most creative use of open data
This challenge is about being as creative as you possibly can be using any open data available under any of this year’s themes. Think outside the box and create!
Go to Challenge | 6 teams have entered this challenge.
Questionable Research Labs
Times of interest
Toi (pronounced "toy") is a tool that lets you visualize the all the COVID-19 locations of interest and outlined by the New Zealand Ministry of Health, and allows you to filter by name and by time.
When you first open the app, you will be brought to the welcome screen

To view the application click on View the map
Note: This screen will be skipped if you have installed as a PWA
The meat of and potatoes of the application happens here

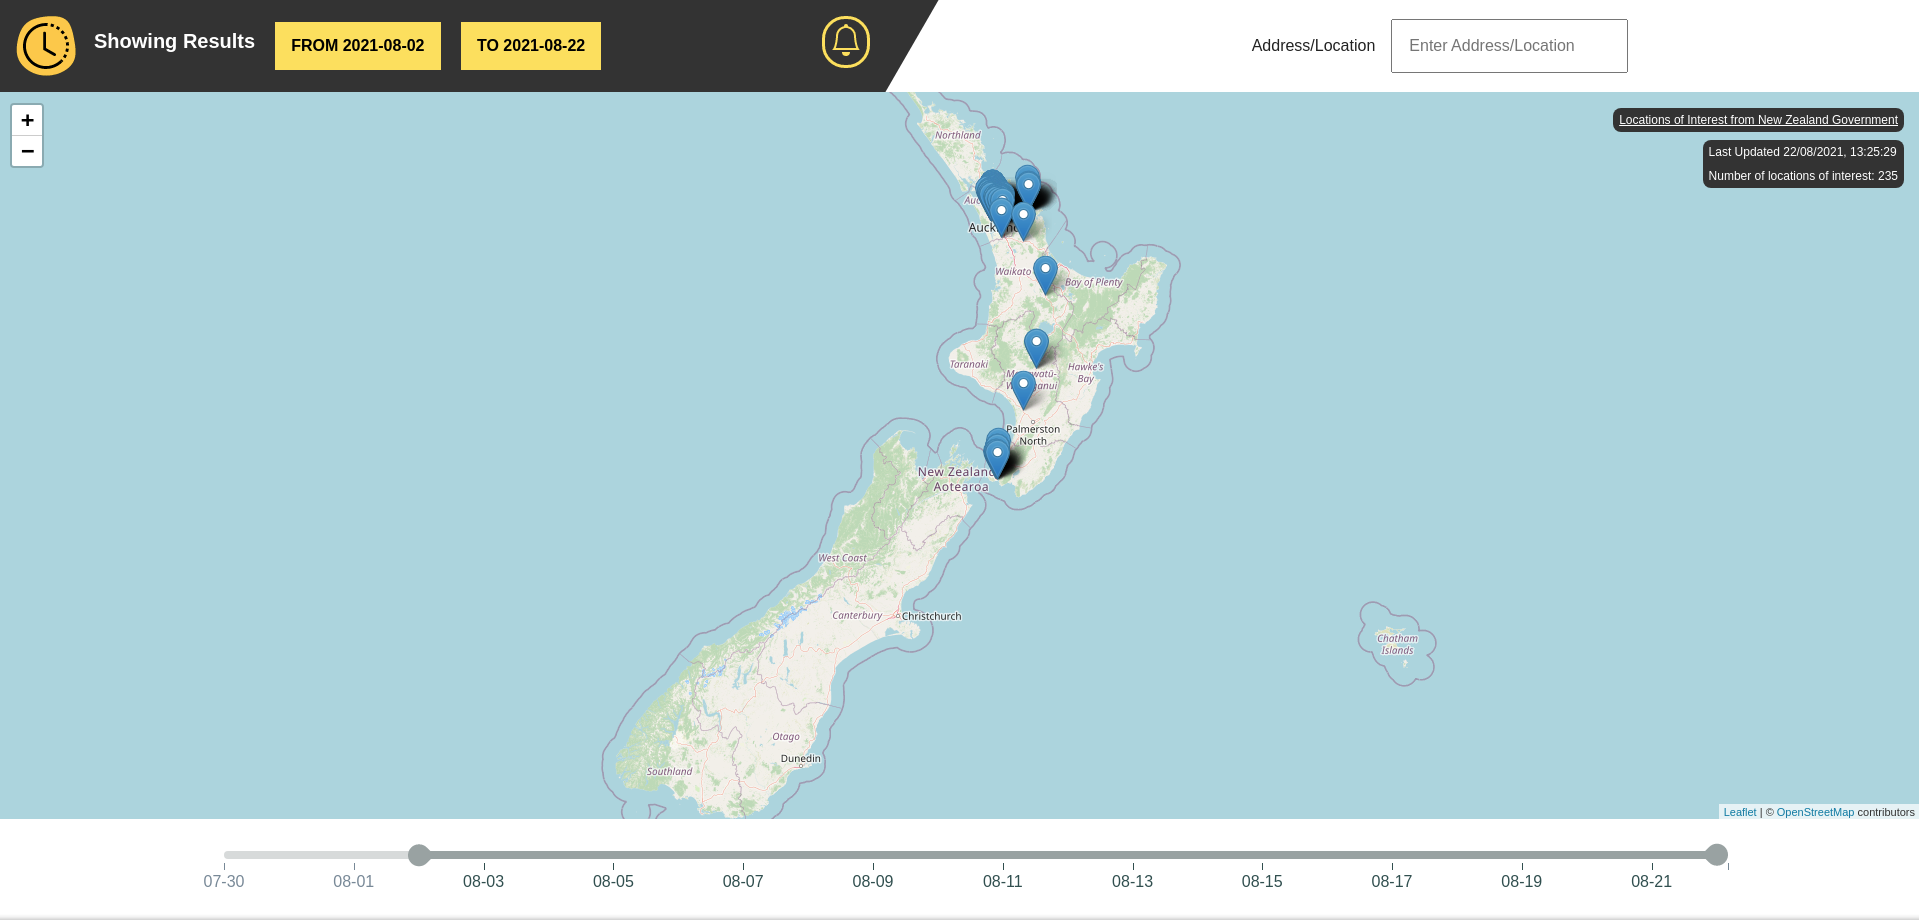
This is the view of the map with all of the COVID-19 locations of interest.
You can filter the locations by using the slider at the bottom

Drag the point change the date range, the filter range will be reflected in the header

Enter the name of the location to filter results in the Address/Location field

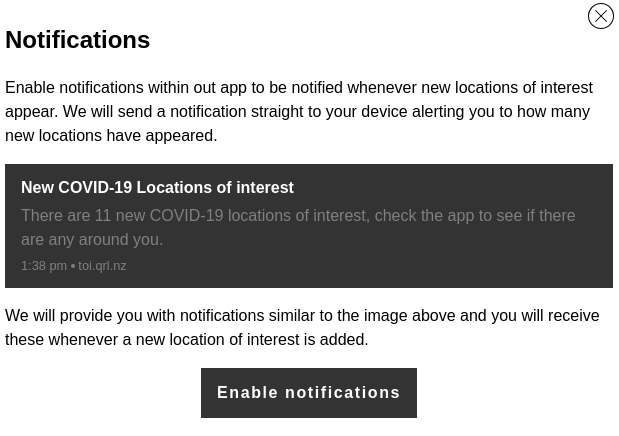
Push notifications for new COVID-19 Locations of Interest can be enable or disabled by pressing the bell button.
![]()
Enable or disable notifications with the button

The dataset we used is from the ministry of health GitHub of all things, they have an auto updating geojson document, which made the initial part of the app fairly simple. It lists the locations of interest as features and includes some useful metadata with them. This dataset is partially good, because of how fast and often it updates.
Description of Use This GeoJSON data is used by our application to show which areas gained new locations of interest each day between the two dates the user specifies.
Go to Challenge | 6 teams have entered this challenge.